
SERVICES
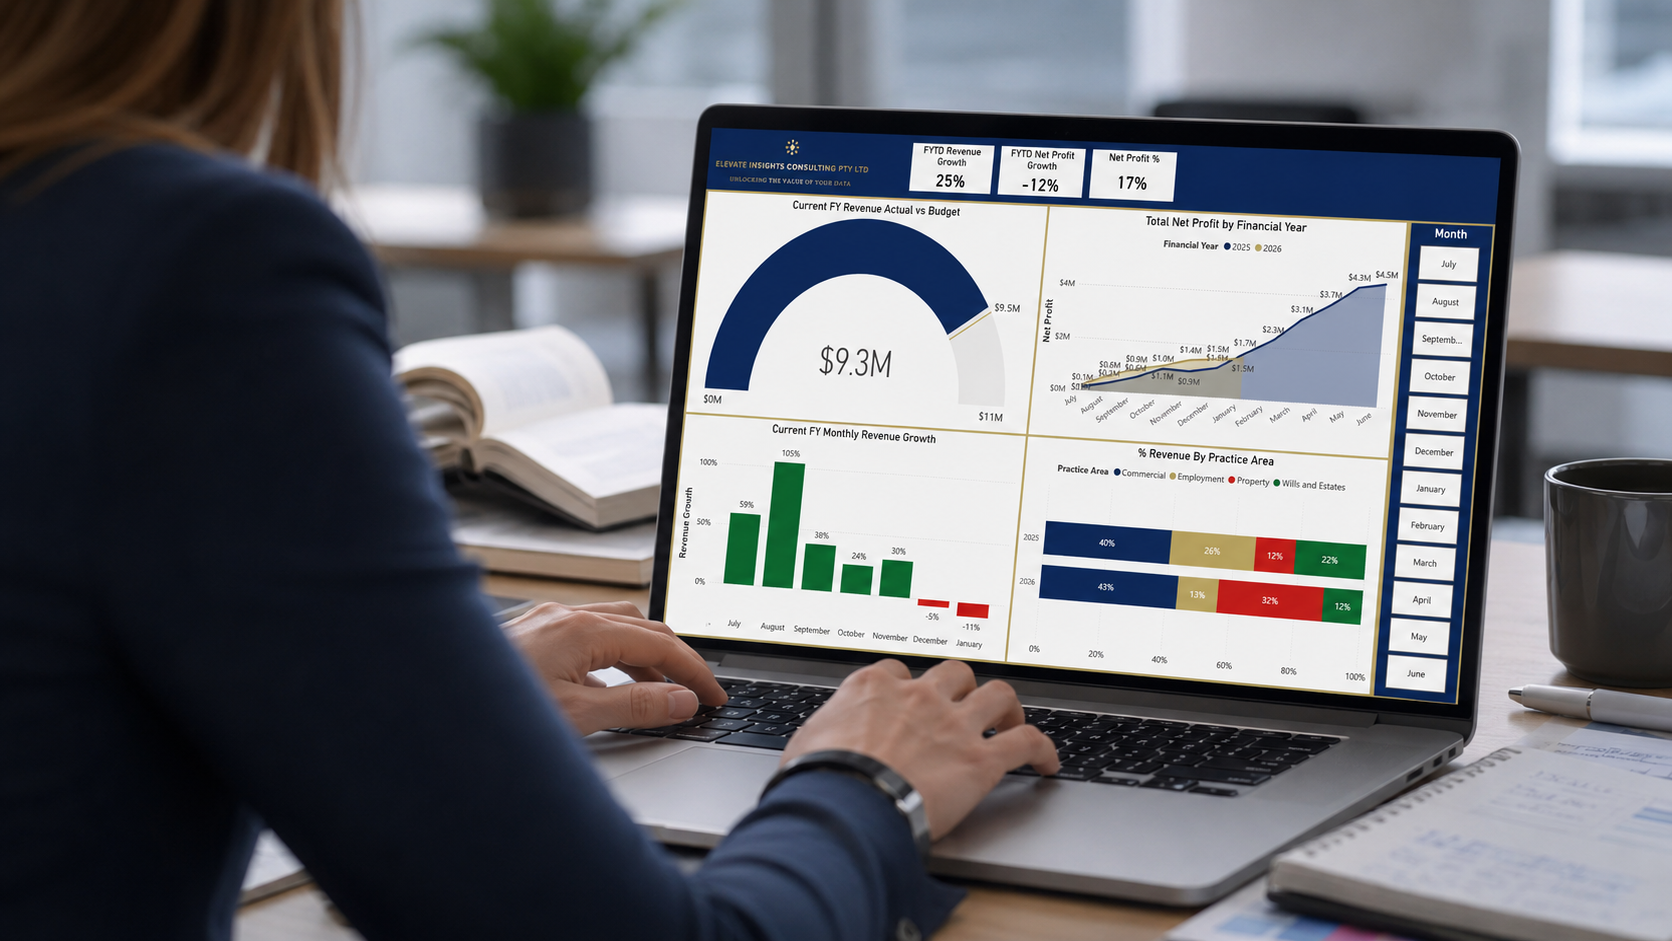
Custom Power BI Dashboards designed around your business
From sales and profitability to operations, people and financial performance, we build dashboards around the information your business needs.
Elevate Insights combines data from multiple systems into one clear reporting solution. The result is instant access to the information you need to monitor performance and plan ahead.
We work with businesses across:
Wholesale & Distribution
Manufacturing & Production

Construction & Trades

Professional Services

Legal
Retail

Medical & Healthcare

Nurseries & Agriculture

Not-for-Profit Organisations

Whether your data comes from accounting software, CRM systems, Practice Management systems, operational platforms, SQL databases or spreadsheets, we can bring it together into a single reporting solution.

How we work
1. Discover
We take the time to understand your business, the systems you use and the information that will be most valuable to your management team.

2. Connect
We connect your data sources and build the reporting structure needed to provide consistent, reliable results.
3. Build
We develop a customised Power BI dashboard designed around the way your business operates and the information your team needs to see.
4. Support
We continue to monitor your dashboard, provide support and help ensure your reporting remains accurate and reliable as your business evolves. An optional monthly check-in can also be scheduled to review your dashboard insights together and discuss potential strategic actions based on the data.

Financial Performance
See how the business is tracking against budget and the previous year. Monitor revenue, growth and net profit, with a clear view of which areas of the business are generating revenue.
Product / Service Profitability
See where your business is making money—and where it isn’t. Gain clear visibility into margins, costs and profitability across products, clients and services so effort can be focused where it has the greatest impact.
Customer Segmentation
Understand which customers and industries are driving growth and where the greatest opportunities lie. Identify your most valuable customers, emerging customer segments and the industries worth targeting with future marketing efforts.
Cashflow and Debtor Management
Understand where cash is tied up and how quickly customers are paying. Track debtor ageing, payment times and outstanding invoices to identify where action is needed to improve cash flow.
Team Utilisation
Understand team capacity, identify who can take on additional work and know when it’s time to hire. Track utilisation against targets to make better resourcing decisions and improve profitability.
Operational Productivity
See how your team is performing against targets and where productivity can be improved. Track individual and team performance, compare results against targets and use leaderboards to quickly identify high performers and areas needing attention.
Ready to see what's possible?
If you're looking for reporting that's tailored to your business rather than generic dashboards, we'd love to discuss how we can help.